Exploratory Data Analysis
THe first thing to do when looking at a preparewd dataset is to explore it a little bit to see what pops out. This is the basis of exploratory data analysis. I see it simply as casting the net wide. It is a good way to find obvious things before the analysis becomes more refined. It is a much worse way than having a specific question in mind so the latter should really be done in most cases for high quality research.
Lets make a fabricated dataset of some endoscopic mucosal resection for Barrett’s related dysplasia and cancers. Lets look at some random aspects of the endoscopic procedure we have extracted and prepared. Here is the input data.
It is worth noting that quite apart from the tools for visualising datasets, there are also tools to give summary statistics. The packages in R can be found here:
summarytools DataExplorer visdat funModeling arsenal dataMaid RtutoR dlookr exploreR xray SmartEDA autoEDA
library(dplyr)
library(GGally)
Age<-sample(1:100, 130, replace=TRUE)
Sex<-sample(c("M","F"), 130, replace = TRUE)
Dx<-sample(c("NDBE","LGD","HGD","IMC"), 130, replace = TRUE)
TimeOfEndoscopy<-sample(1:60, 130, replace=TRUE)
MidazolamDose<-sample(1:10, 130, replace=TRUE)
SurgeryorNoSurgery<-sample(c("Surgery","NoSurgery"), 130, replace = TRUE)
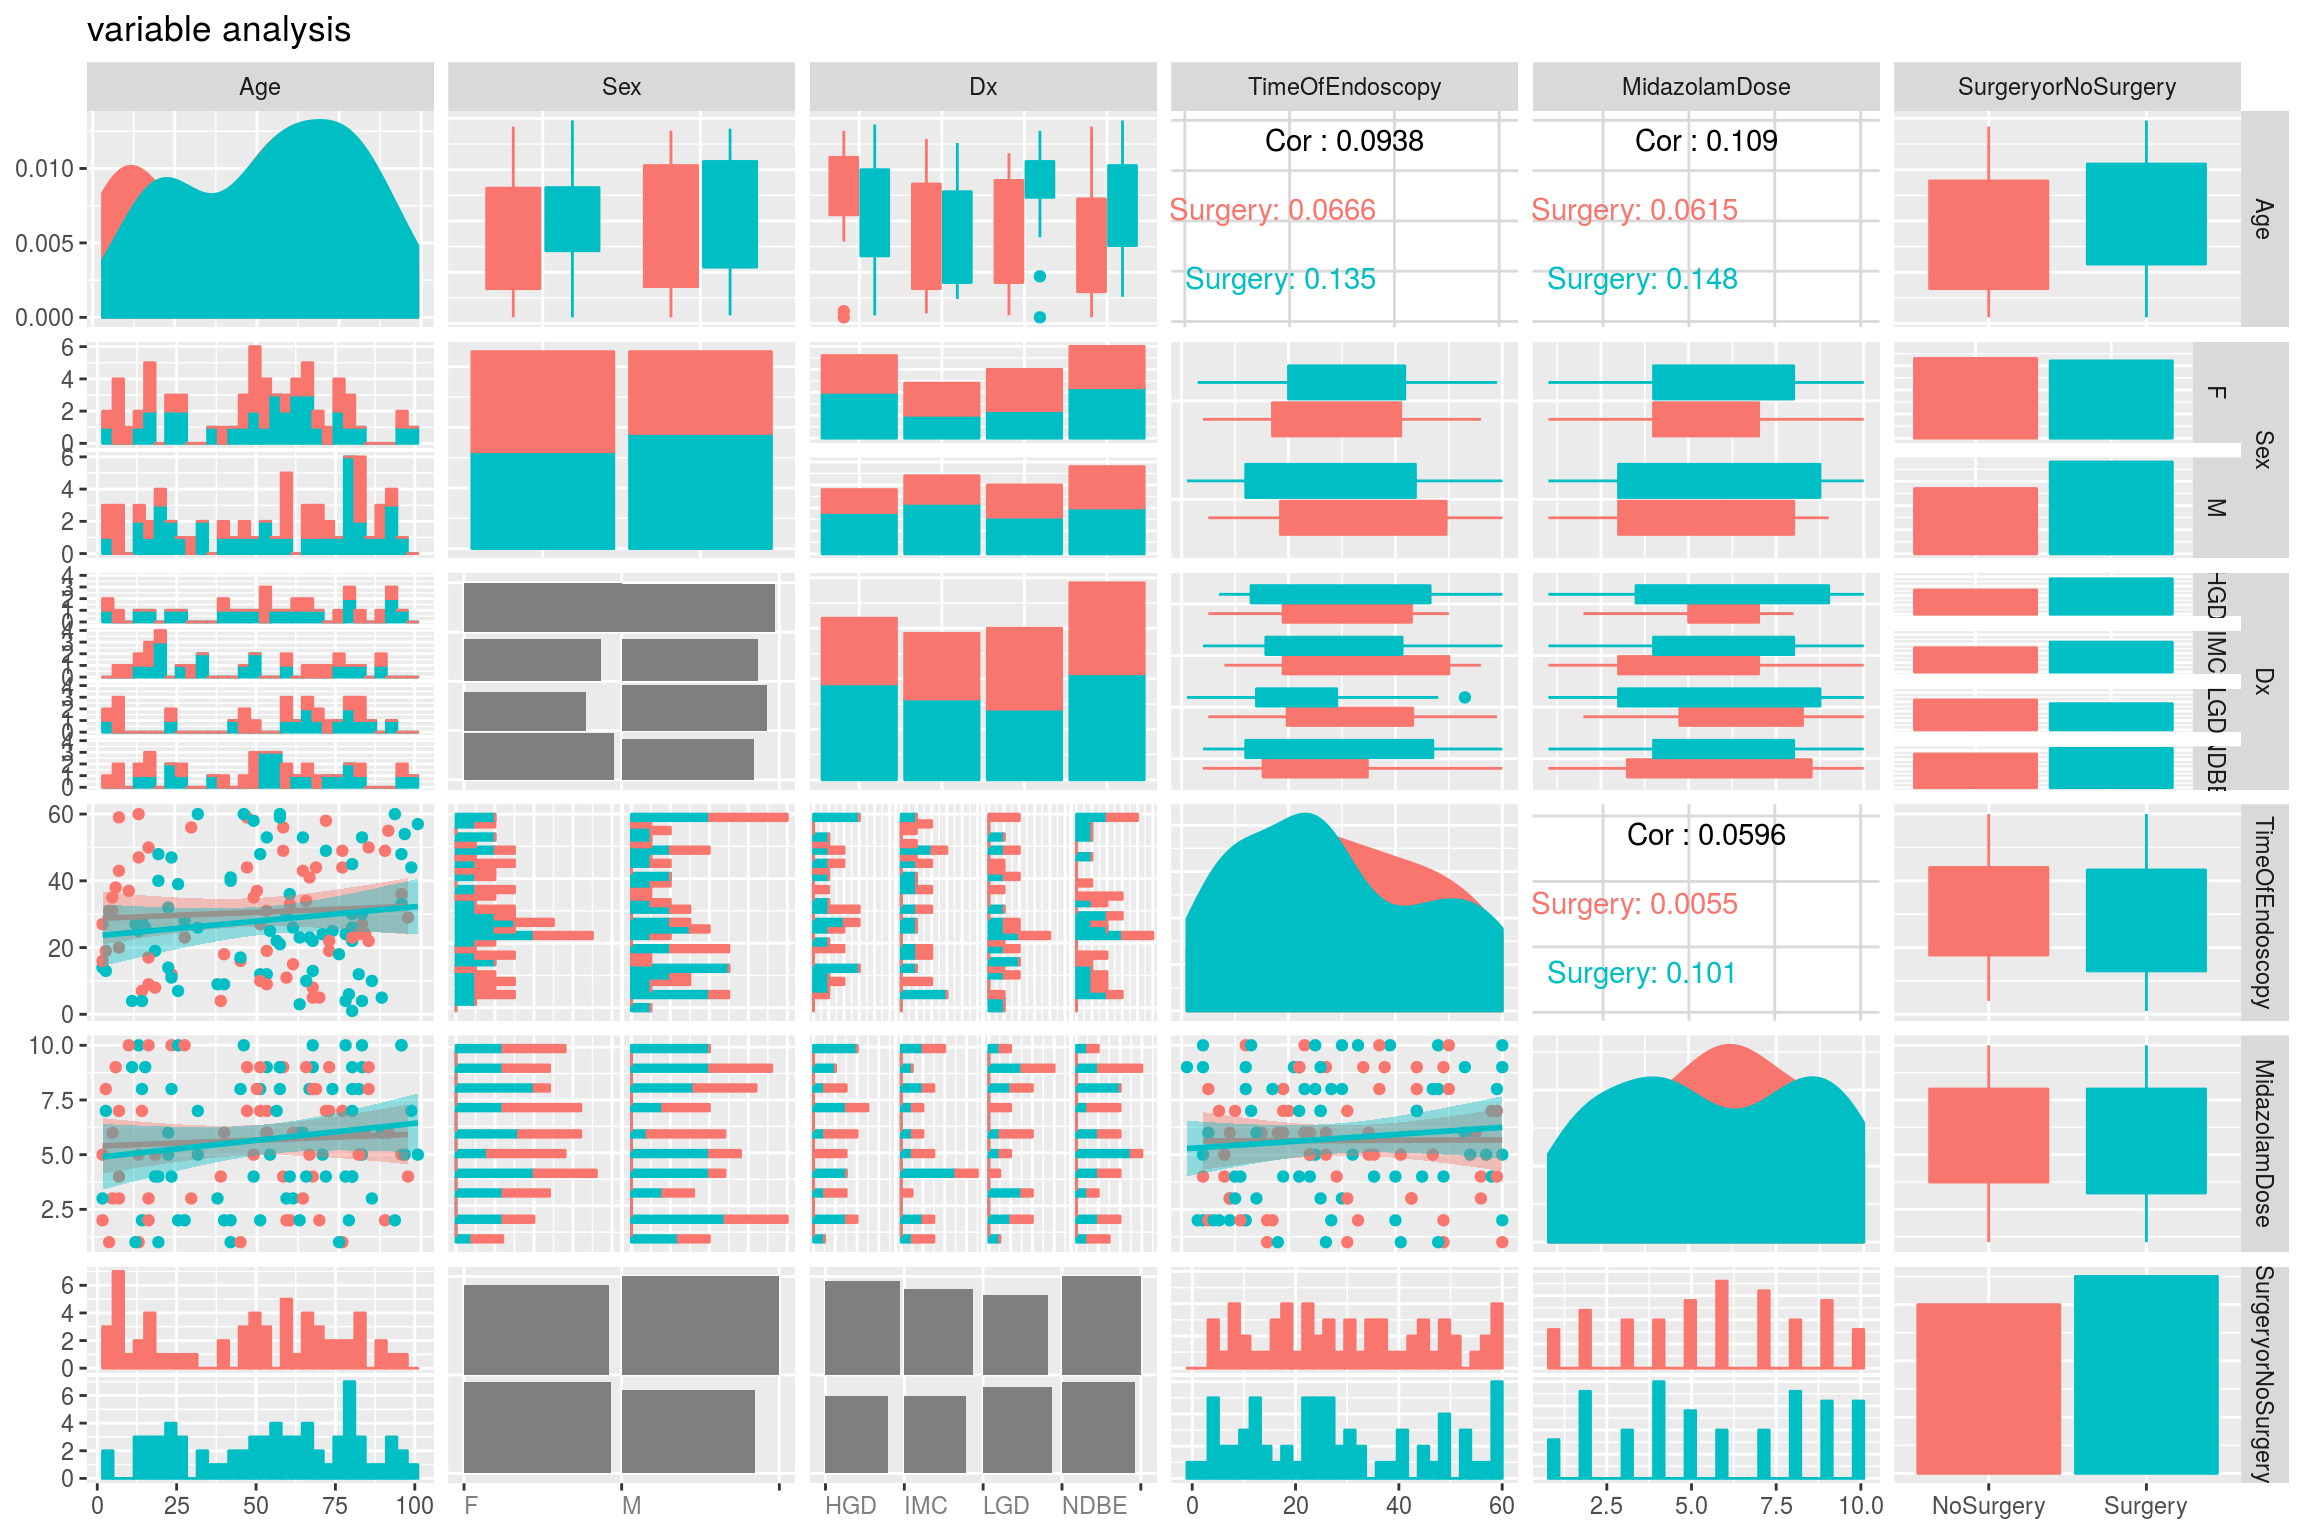
EMRdf<-data.frame(Age,Sex,Dx,TimeOfEndoscopy,MidazolamDose,SurgeryorNoSurgery,stringsAsFactors=F)Let’s say we are interested in the differences between those who have needed surgery vs those who did not need surgery in terms of all the other things we have measured (and you will note that there is both categorical and numerical data included here). We can to the exploratory data analysis using the excellent package GGally As follows:
ggpairs(EMRdf,
        colour=c("SurgeryorNoSurgery"),
        diag=list(continuous="density",   discrete="bar"),
        title="variable analysis",
        upper = list(continuous = "cor",discrete="facetbar"),
        lower = list(continuous = "smooth",discrete="ratio"),
        mapping=ggplot2::aes(fill = SurgeryorNoSurgery,colour=SurgeryorNoSurgery)
)
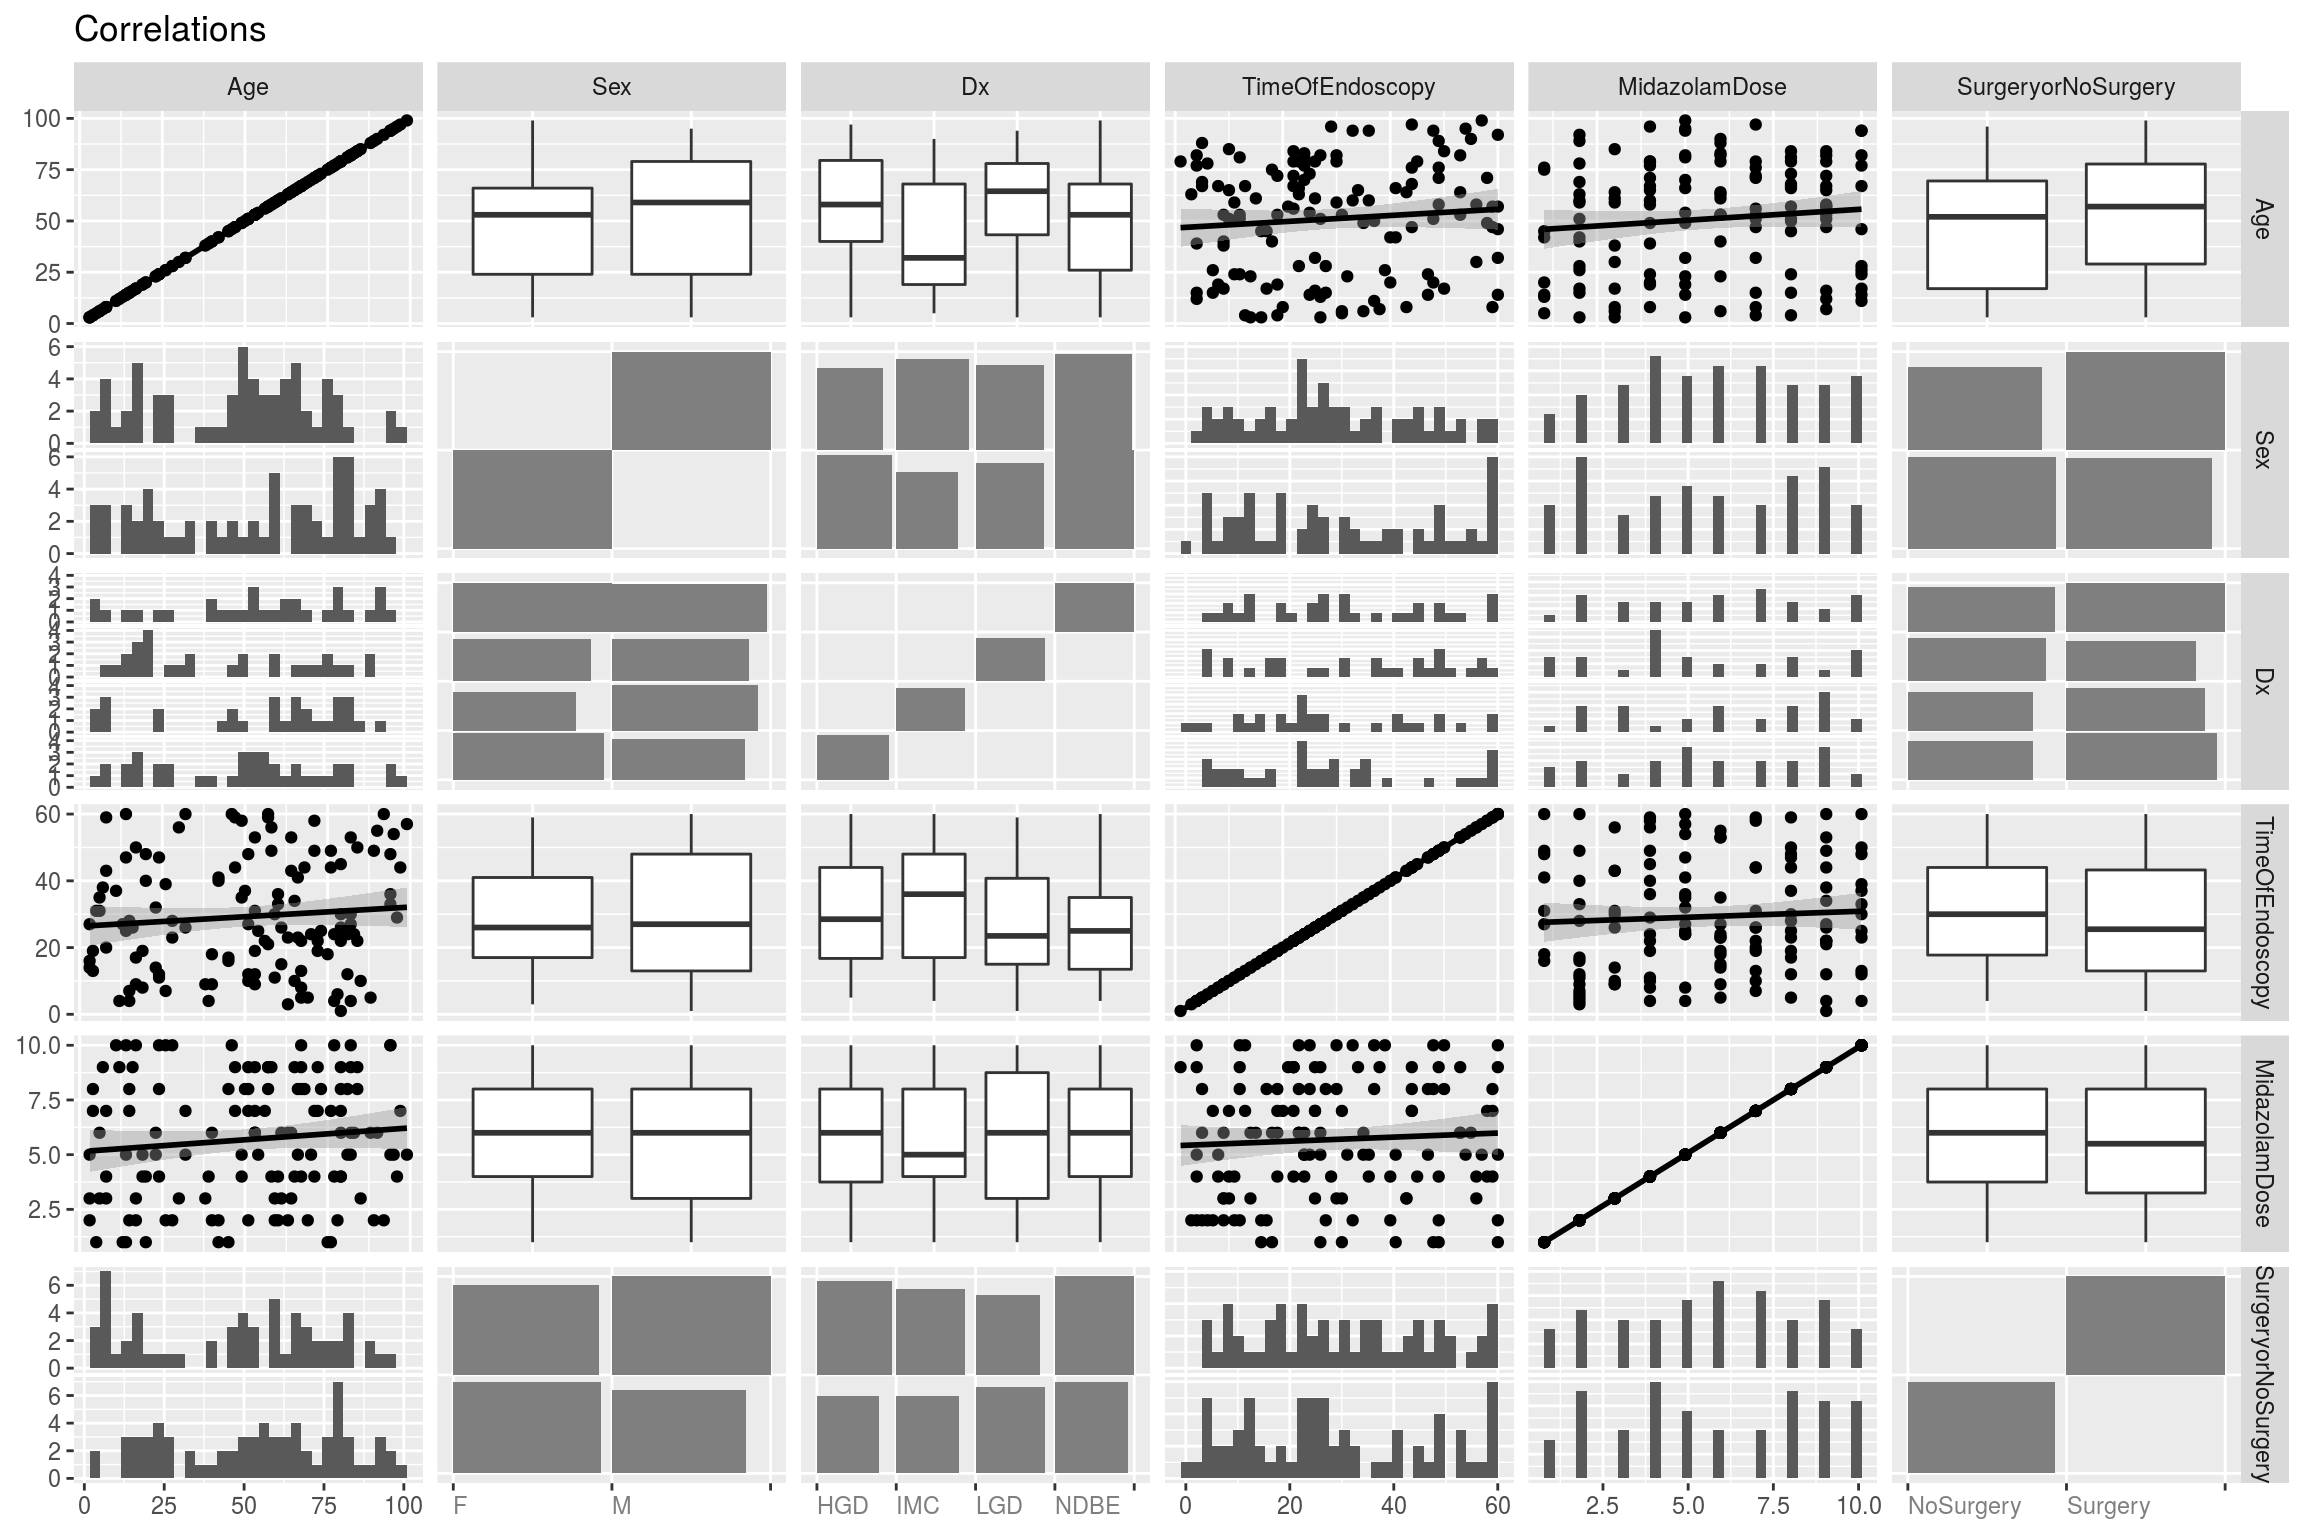
If you are more interested in pairs plots for two group data you can use the following instead:
GGally::ggduo(
  EMRdf,
  types = list(continuous = "smooth_lm"),
  title = "Correlations",
)